Document reader
Turns PDFs (born-digital or scanned), images, forms and handwriting into elements a checker can cite: text in reading order, tables as cells with row and column spans, form fields and checkboxes, each with its page and box, and a signed receipt over the page pixels and the model revisions.
Measured 2026-09-26. Full eval. First use: HCC evidence file (scanned charts).
Watch a real run
Two recorded runs: a synthetic chart printed, signed and scanned into an image-only PDF, and a born-digital PDF with a financial table. Every box is an element you can cite.
Loading the recorded run…
How it reads a page
- Docling (MIT) finds and orders the regions of each page with its Heron layout model (Apache-2.0).
- PaddleOCR-VL-1.6 (0.9B, Apache-2.0) reads each region: text, or a table as cells with spans. Chosen by an A/B of four ~1B parsers.
- Born-digital PDF pages take their text from the PDF's own text layer; only tables are read from pixels, and every number in them is checked against that layer.
- Where the parser is unsure (mean token probability under 0.90), Qwen3.8-27B re-reads the region from the image. Both readings are kept.
- Form fields: Qwen3.8 reads the page image with the element list and returns each value tied to an element; a value that is not in its element's text is marked as read from the image.
- decosa-api signs a decosa.docreader-receipt.v1: the file hash, each page's pixel hash, the layout and parser revisions, the hashes of the elements and fields, and the Qwen receipts.
Other blocks cite an element as p3 [120,488,940,66]: page, then the box in the page raster's pixels (PDFs at 144 DPI, so points are pixels divided by two). An element looks like this:
{
 "id": "p1-e16",
 "page": 1,
 "kind": "text",
 "bbox": [
  101,
  478,
  838,
  306
 ],
 "order": 15,
 "text": "Follow-up for diabetes, kidney disease and heart failure. Vitals: blood pressure 138/82 ...",
 "source": "parser",
 "conf_bp": 9958
}
API
| POST /docreader/read | {file_b64, synthetic: true, forms?, schema?, stream?} or {sample} -> pages of elements, fields, models, a signed receipt. Any valid session token or dk_ key. |
| POST /docreader/verify | {document} -> signature, signer, elements, fields and page checks. No key. |
| GET /docreader/info | Models and pinned revisions, limits, whether the parser service is reachable, what it does not do. |
| GET /docreader/samples/{id} | The synthetic sample PDFs: scanned-chart, born-digital. |
| POST /hcc/read-chart | The first integration: a scanned chart read into notes, then the HCC review with every quote cited to page and box. |
| POST /docreader/chart | {image_b64, synthetic: true, method?: hybrid | model | geometry, hint?} or {sample} -> the chart as data (KM survival, medians, numbers at risk, HR; forest rows; bar and line values), plot box, method, confidence, receipts, a signed chart receipt. |
| POST /docreader/read {charts: true} | Figure regions are read by the chart reader; each figure element gets its chart, covered by the document receipt. |
| POST /docreader/chart/verify | {chart} -> signature, signer, table and image checks. No key. |
Hosted, the reader takes synthetic or public documents only; self-host it for real ones. Limits: 12 MB and 10 pages per call on the hosted instance.
Which page parser, and why
Dev slices, same Docling regions for every parser, each parser's own element-level prompts, greedy, bf16, Mac Studio (M3 Ultra). Page text: 30 English OmniDocBench pages. Tables: 40 FinTabNet tables. Handwriting: 40 IAM lines.
| Parser | Page text NED ↓ | Word F1 | Table TEDS | Table numbers tied | Handwriting CER | s / page (solo) | Peak memory |
|---|---|---|---|---|---|---|---|
| PaddleOCR-VL-1.6 (chosen) | 0.228 | 0.830 | 0.963 | 98.3% | 4.9% | 3.3 (MLX) | 2.9 GB |
| MinerU2.5-Pro-2605 | 0.235 | 0.805 | 0.973 | 87.1% | 4.0% | 11.6 | 5.7 GB |
| TeleOCR | 0.207 | 0.850 | 0.895 | 82.2% | 12.0% | 23.7 | 7.5 GB |
| OvisOCR2 | 0.236 | 0.845 | 0.795 | 61.4% | 3.6% | 22.5 | 6.8 GB |
| Tesseract 5.3.4 (what we used before) | 0.333 | 0.703 | no tables | — | 42.0% | — | — |
Numeric grounding quotes numbers read from tables, so tied table numbers decide it: PaddleOCR-VL tied 98.3% of numeric cells on dev against 87% for the next. Its page text is within 0.02 of the best, and it is 3.5 to 7 times faster on the Mac at half the memory. Its handwriting gap is what the Qwen3.8 re-read covers. Speeds are for different runtimes: PaddleOCR-VL on MLX, the others on transformers (PaddleOCR-VL under transformers on the Mac ran at about 7 tokens a second).
Held-out results
PaddleOCR-VL-1.6, run once after the dev work was frozen.
| Test | Result | For comparison |
|---|---|---|
| Page text, 84 English OmniDocBench pages: NED / word F1 | 0.148 / 0.876 | Tesseract: 0.239 / 0.763 |
| Tables on those pages (24): TEDS | 0.818 | Tesseract: no tables |
| FinTabNet, 200 tables: TEDS | 0.930 | |
| FinTabNet: numeric cells tied, cell for cell | 83.8% | 94.7% of numbers read right somewhere in the table |
| IAM, 200 handwritten lines: CER | 4.0% with Qwen re-reads (81 lines re-read) | PaddleOCR-VL alone 4.7%; Qwen3.8 alone 3.6%; Tesseract 52.9% |
| CORD, 75 receipts, 9 total fields: F1 | 0.875 | Qwen3.8 on the image alone: 0.895 (but no boxes) |
| FUNSD, 35 forms: key F1 / value F1 | 0.586 / 0.615 | Qwen3.8 on the image alone: 0.501 / 0.489 |
Table numbers read from scans are below the 99% bar we set before trusting them in numeric grounding (83.8% held out). Born-digital tables are checked number by number against the PDF's text layer; numbers from scanned tables go to a person.
First use: HCC charts, scanned vs text
Synthetic HCC members (invented people and notes), each note printed on its own page with a signature block, scanned into an image-only PDF, and reviewed; the text version of the same members through the existing path, on the same server at the same time.
| Measure | Result |
|---|---|
| Verdict accuracy, scanned vs text (50 members, 200 codes, held out) | 187 / 200 vs 192 / 200 |
| Same verdict, scanned vs text | 195 / 200 |
| False keeps on scans (unsupported or held codes called supported) | 0 |
| Header fields read right (date, record type, provider, credential, signed) | 181 / 182 each |
| Quotes cited to page and box | 315 / 315 |
| Time per member (3 in parallel) | about 38 s scanned, 10 s text |
| Later held-out splits | Result |
|---|---|
| Fresh split 1 (after fix 1): scanned vs text | 190 / 200 vs 191 / 200; 1 false keep on scans (a coder's addendum read into the note), fixed |
| Fresh split 2 (after fix 2): scanned vs text | 189 / 200 vs 190 / 200; same verdict 195 / 200 |
| Fresh split 2: false keeps on scans | 0 |
| Fresh split 2: header fields read right; quotes cited | 166 / 166 each; 326 / 326 |
Each held-out split was run once and each found one reading bug, fixed before the next: on the test split a note body dropped when the layout's reading order put a header value after it (codes deleted, never kept); on the first fresh split a coder's addendum whose heading the layout missed was read into the physician's note, and its code was kept. After both fixes, 50 new members: no false keeps. On scans, never keeping a code it should not depends on the reader separating notes and addenda correctly, so each page's split is shown in the answer.
Charts back into numbers
Figures back into numbers, so what a report says about a chart can be checked: Kaplan-Meier curves (survival at a time, medians, numbers at risk, a printed hazard ratio), forest plots (estimate and 95% CI per subgroup), and bar and line charts in annual reports and lay summaries.
- Qwen3.8 reads the labels and structure: tick labels, legend names and colours, row labels, printed numbers. One receipted call per chart.
- Code measures the geometry against those tick labels: the plot box and tick marks, each series by its colour, KM step curves traced left to right, forest markers and whiskers, bar edges to a fraction of a pixel.
- The page parser (PaddleOCR-VL-1.6) reads the number-at-risk table and printed forest values. Printed numbers are kept when the drawing agrees with them; when it does not, the row is flagged.
- If the axes cannot be calibrated, the model's own reading is returned and marked as such.
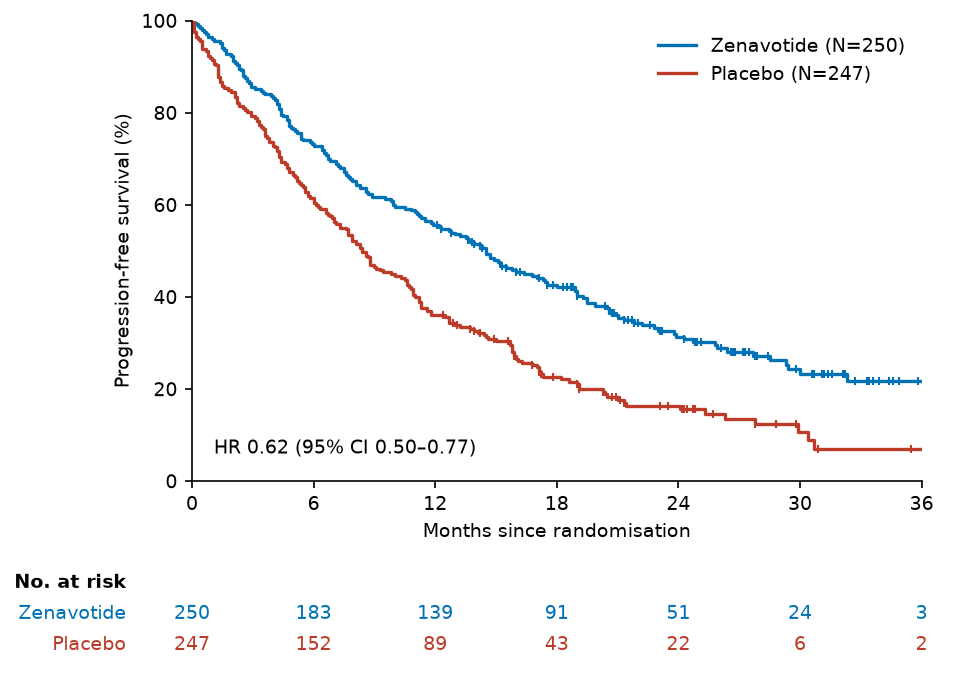
The sample KM plot (fictional trial), read by the hosted API on 27 Sep 2026.
| Read from the figure | Chart reader | True |
|---|---|---|
| Median PFS, zenavotide | 14.48 months | 14.5 |
| Median PFS, placebo | 8.46 months | 8.4 |
| PFS at 12 months, zenavotide / placebo | 55.5% / 36.0% | 55.6% / 36.0% |
| Numbers at risk (14 cells) | all exact | |
| Hazard ratio (printed) | 0.62 (0.50 to 0.77) | 0.62 (0.50 to 0.77) |
Held out: 240 synthetic charts (60 per kind; half clean, a quarter JPEG, a quarter scans), scored once. Same charts for every method.
| Method | KM survival within 2 points | KM median within 1% of the axis | Numbers at risk exact | Forest: estimate and CI within 3% | Bars within 2% | Lines within 2% |
|---|---|---|---|---|---|---|
| Qwen3.8 alone | 58.7% | 13.1% | 97.1% | 62.4% | 73.6% | 81.9% |
| PaddleOCR-VL chart task | 59.0% | 23.4% | 48.7% | 58.7% | 44.2% | 76.4% |
| Code only (+ page parser) | 61.9% | 59.9% | 52.1% | 87.8% | 74.3% | 82.2% |
| Hybrid (chosen) | 84.5% | 79.6% | 89.6% | 90.8% | 88.5% | 92.1% |
A log-axis fix found on the test set lifts hybrid forest rows to 99.8% (re-scored once after the fix, so not a clean held-out number). On clean charts hybrid medians are within 1% of the axis 88% of the time; on scans KM survival within 2 points drops to 74%. DePlot (Apache-2.0), on 60 of the same charts: 28% of KM survival values within 2 points, 0% of forest rows, 21% of bars; good only on simple lines (88%).
Five US public-domain figures (NCHS Data Briefs 480 and 492; an FDA statistical review, NDA 207103), labelled from the numbers the same documents print.
| Figures | Result |
|---|---|
| NCHS bar charts, 3 figures, 40 bars | The model read the printed values exactly on two of three; the geometry fell back each time (no tick marks on the category axis, ticks drawn inwards). Group header rows shifted the third chart's categories. |
| FDA KM plots, 2 figures | Three of four printed medians found within 0.8% of the axis (the model alone: 3.6% to 14.7% off). A dashed red curve crossing a dashed black one was not traced. |
In the CSR number-to-table verifier (figures: true), claims about KM medians, rates at a timepoint and hazard ratios, overall or for a subgroup's forest row, are checked against the figures within what the drawing can resolve. On the fictional ZEN-301 samples, the planted placebo median (9.7 stated, the curve crosses 50% at 8.5) and a subgroup HR (0.77 stated, 0.71 printed) were flagged and the 7 true claims were consistent, from JSON and from a PDF page where the document reader found the figure. A demo on our own samples, not a measured catch rate.
No open chart model with a clean licence reads KM or forest plots well. Our generator makes unlimited charts with exact truth, so a small chart model trained on it (for example PaddleOCR-VL-1.6 on its chart task) is a candidate for our own open model; proposed, not trained yet. Measured 2026-09-27. Chart reader eval.
Where it goes next
HCC / RADV evidence filebuilt
Scanned charts to notes, the same review, quotes cited to page and box.
CSR number-to-table verifierbuilt
Clinical study reports as PDFs or scans: the narrative's paragraphs and every in-text table and TLF read into cells, so each number can be traced to its cell and checked in code. With figures: true, what the text says about Kaplan-Meier medians, rates and hazard ratios is checked against the figures, read back into numbers.
GPSR listing packnext
Declarations of conformity and test reports read with a schema for manufacturer, responsible person, product identifiers, standards and warnings; every listing field traced to a box.
CMMC evidence mapnext
SSP and policy binders: born-digital pages cost almost nothing (text layer); each practice's evidence cited to page and box instead of a file name.
Denial appeal packetnext
Faxed denial letters: claim number, reason, deadline read with cites; a deadline read from the image alone is confirmed by a person.
SNAP pre-QCnext
Pay stubs, statements and bills: amounts read with cites and recomputed by numeric grounding; amounts from scans go to a person. Self-host only (PII).
Self-host
Two processes: the docreader service holds the models; decosa-api calls it for each page, adds the text layer, re-reads and fields, and signs. On a Mac:
python3.12 -m venv .venv && . .venv/bin/activate
pip install -r services/docreader/requirements-mac.txt
hf download PaddlePaddle/PaddleOCR-VL-1.6 --revision c5630abae1d940eafe0697512a0325494b02ab42 --local-dir models/PaddleOCR-VL-1.6
DOCREADER_MODELS=$PWD/models DOCREADER_PARSER=paddle-mlx python services/docreader/server.py
DECOSA_DOCREADER_URL=http://127.0.0.1:8497 DECOSA_DOCREADER_SYNTHETIC_ONLY=0 python -m decosa_api
On an NVIDIA GPU, the parser under vLLM and the service beside it:
hf download PaddlePaddle/PaddleOCR-VL-1.6 --revision c5630abae1d940eafe0697512a0325494b02ab42 --local-dir /models/PaddleOCR-VL-1.6
docker run --gpus device=0 --ipc=host -p 127.0.0.1:8498:8000 -v /models/PaddleOCR-VL-1.6:/model:ro vllm/vllm-openai@sha256:c2914767605584b6d8f45686b82de173ecc99e781897aa3d0a66dacd72c51ae1 /model --served-model-name PaddlePaddle/PaddleOCR-VL-1.6 --trust-remote-code --max-model-len 8192 --gpu-memory-utilization 0.04 --max-num-seqs 16 --no-enable-prefix-caching --mm-processor-cache-gb 0 --generation-config vllm
docker build -t decosa-docreader services/docreader
docker run --gpus all --network host -e DOCREADER_PARSER_URL=http://127.0.0.1:8498/v1 -e DOCREADER_PARSER_MODEL=PaddlePaddle/PaddleOCR-VL-1.6 decosa-docreader
Then rehearse on the bundled synthetic PDFs before any real document: python scripts/rehearse.py document-reader. Both paths are measured. GPU (how the hosted API runs it since 27 Sep 2026: vLLM 0.29.0 on an RTX PRO 6000 shared with other services; systemd units in deploy/systemd): 5.7 GB peak for parser and layout together, 1.6 s a page reading the bench pages, 2.4 s a page end to end on the 84 held-out pages, and the same accuracy as the Mac on the same pages (text NED 0.148 on both, table numbers tied 84.4% vs 83.8%, handwriting CER 4.6% vs 4.7%). Mac (mlx-vlm, the eval runtime): 3.3 s a page for reading plus up to 1 s of layout; about 3 GB. --gpu-memory-utilization is a share of the whole card: 0.04 is 3.8 GiB of a 96 GB card, so raise it on a smaller one.
Licences and receipts
| PaddleOCR-VL-1.6 | Apache-2.0 (LICENSE file), PaddlePaddle/PaddleOCR-VL-1.6 @ c5630ab |
| Docling and its Heron layout model | MIT; Apache-2.0, docling-layout-heron @ 8f39ad3 |
| Qwen3.8-27B | Apache-2.0, already served |
| pypdfium2 / PDFium | Apache-2.0 or BSD-3-Clause / BSD-3-Clause |
| Chart reader | numpy and Pillow (BSD-style, MIT-CMU); models as above. DePlot (Apache-2.0) measured, not used. UniChart and ChartInstruct (GPL-3.0), ChartGemma (Gemma terms), ChartLlama (research only) left out |
| Not used | MinerU2.5-2509 (now AGPL-3.0; the Pro-2605 weights are Apache-2.0); Datalab Marker, Surya and Chandra (the weights forbid competing use) |
The parse runs outside our gateway today, so the document receipt is signed by decosa-api's own key: an attestation by its operator. The gateway design for model-call receipts (the service signs what it read; the gateway, which sees the bytes, countersigns) is in decosa-api docs/design/model-call-receipt.md, not deployed.
What it does not do
- English only; no other language was measured.
- Numbers in scanned tables are not trusted without a person (83.8% tied held out).
- Handwriting: 4.0% character error rate on IAM lines with re-reads. Fine for search and review, not for a name or a number unchecked.
- Formulas are read as text, not checked. Photos and figures other than Kaplan-Meier, forest, bar and line charts are located, not described.
- A signature is noted as present or absent, never verified.
- The hosted API takes synthetic documents only. The parser service runs next to it since 27 Sep 2026; the consoles do not offer uploads of scans yet.
- Chart values carry the drawing's resolution: a median read from a curve is within about 1% of the time axis on clean charts, not exact. Scans, curves told apart only by dash, and category axes without tick marks are read less well.